A sharp correction in small and mid cap risk assets globally has been well masked at
the index level by active rotation into more heavily weighted, large cap, defensive,
yield oriented, positions. We are now in the third year of a cyclical bull market and
there are rising concerns that the end to QE2, sovereign debt problems in Europe,
tightened reserve requirements in China and focus on deficit reduction in the US
could curtail the recovery. These concerns serve to put more emphasis on the value
of a steady stream of income. It is clear that investors continue to favor yield with
some inflation protection as we see continued strength in common shares with
growing dividends, reits and high yield bonds.
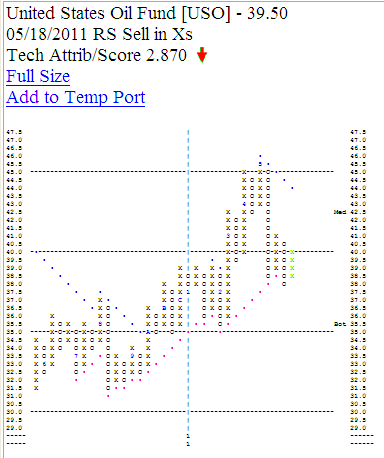
In the world of equities, commodities fell victim to coordinated hikes in margin
requirements which has driven liquidation across the complex. If the goal was to
cool speculative interest, it is clear that in at least the short run, policy makers are
having success.
As is our strategy, we don't fight the tape. Defense in risk assets appears to be the
path best followed until there is evidence to the contrary. Risk models for Canada,
Brazil, China, India and Australia have turned lower. Equity portfolios holdings are
focused in targeted large cap situations where there are catalysts driving rising
earnings estimates and likelihood of re-valuation. Sector exposures include industrials,
telecom, healthcare and consumer. Barometer sector risk models have moved us away
from metals, golds and energy that provided us such strong returns in Q4 2010 and
early 2011. When these factors are paired with weakness in the Nasdaq risk model,
it will be clear why we are operating with a reduced net long exposure across all equity
mandates.